Finances
Most (but not all) scenarios in OpenRCT2 require you to manage money. This manifests itself in multiple ways:
You have to make sure you don’t run out of money.
Most scenarios either allow asking a park entry fee or a fee per ride, but not both.
Some scenarios also have objectives that involve money, like achieving a certain park value or selling a certain amount in your shops.
Income and expenses types
In OpenRCT2, income and expenses are divided into 14 groups:
Ride construction: Costs incurred when building or extending rides. This includes shops and stalls.
Ride running costs: Tracked rides have variable running costs (based on how large and extravagant they are), while flat rides and shops have fixed running costs (not counting shop stock).
Land purchase: Some scenarios allow you to buy additional land or construction rights. While the cost per square might look low, keep in mind that you often need to buy quite a few squares to fit new rides.
Landscaping: This includes raising/lowering land and placing scenery. Raising and lowering land can cost a lot of money.
Park entrance tickets: Self-explanatory.
Ride tickets: Self-explanatory.
Shop sales: Shops are cheap to build, but provide some additional income, as well as keeping your guests happy. Includes on-ride photo sales.
Shop stock: Self-explanatory.
Food/drink sales:: See “Shop sales”.
Food/drink stock: Self-explanatory.
Staff wages: These are paid every week. You can see how high the wages for every staff member are in the Staff window.
Marketing: Marketing brings extra guests to your park. This costs money, but successful campaigns pay for themselves.
Research: Researching new rides and scenery costs money, but you can set the amount of funding in the Research window.
Loan interest: Paid every week.
Managing finances
You can open the Finances window in three ways:
By clicking the amount of money you have:

By clicking the button in the toolbar, if you have it enabled:

By pressing the hotkey (defaults to
F).
The window will now open. There are six tabs:
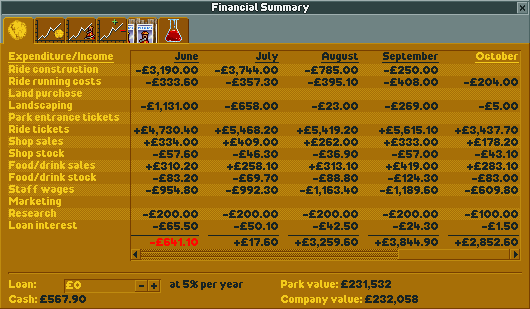
Financial Summary: provides an income/expenditure table, lists current loan, park value and company value and allow setting your loan.
Financial Graph: shows your cash (minus loan) over time.
Park Value Graph: shows your park value over time.
Profit Graph: shows your weekly profit over time.
Marketing: allows you to start new marketing campaigns, and lists which ones are currently running.
Research Funding: allows you to set how much money to spend on R&D every month, as well as which areas should have priority.